Data is everywhere! Surveys, reports, social posts, and headlines. But not all data is created equal. Knowing how to evaluate it can save you from bad decisions and help you build smarter strategies.
Here’s a quick guide to reading data with confidence.


01. how to evaluate data like a pro
Before using data in your research or strategy, ask:
- What is the sample size?
- A large sample size usually produces more reliable data
- Where is the data from?
- Is the source unbiased and reliable?
- Do I understand what the numbers actually mean?
- You need to have a basic understanding of statistics to evaluate the data.
Good data tells a clear, honest story. Bad data creates confusion.
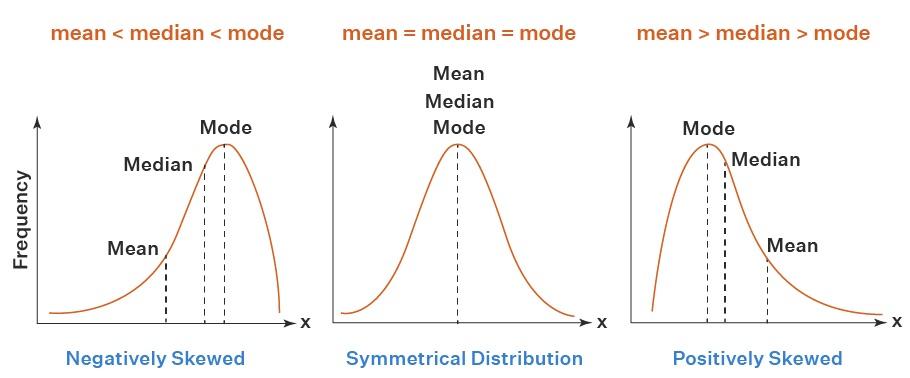
02. understanding the numbers
No need to panic: You don’t need an advanced degree in statistics. You just need the basics.
- Mean: The average. Add all numbers together and divide by the number of units.
- Median: The middle number when all values are listed in order.
- Mode: The number that appears most often.
Knowing which one is used (and why) can completely change how you interpret results.

Cue Math
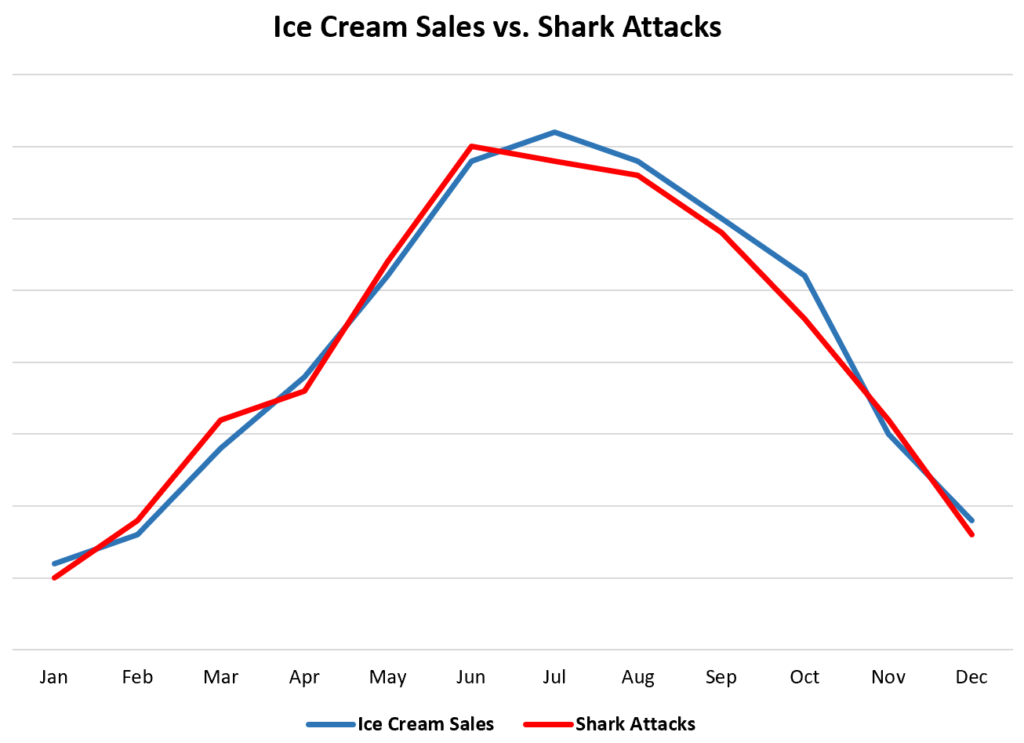
03. correlation vs. causation
- Correlation: Two variables move together — but one doesn’t necessarily cause the other.
- Causation: One variable directly causes a change in another.
Just because two things are connected doesn’t mean one caused the other. This mistake shows up often in marketing data.

Statology
need help with research?
Strong design and marketing start with strong data. If you’re unsure how to collect, evaluate, or present research, FPM can help.
